Start with what you know
One search box for an owner’s name, address, or assessment number.
SMARTMAPS BY PRAESES
Bring property information and community context together in a public maps site people can use with confidence.
For residents. For real estate professionals. For your office.
Property information for your community.
Visual insight for your office.
01 / THE PUBLIC MAPS SITE
Make your public site a useful starting point for the people you serve. Search, explore a parcel, and find the local information connected to it.
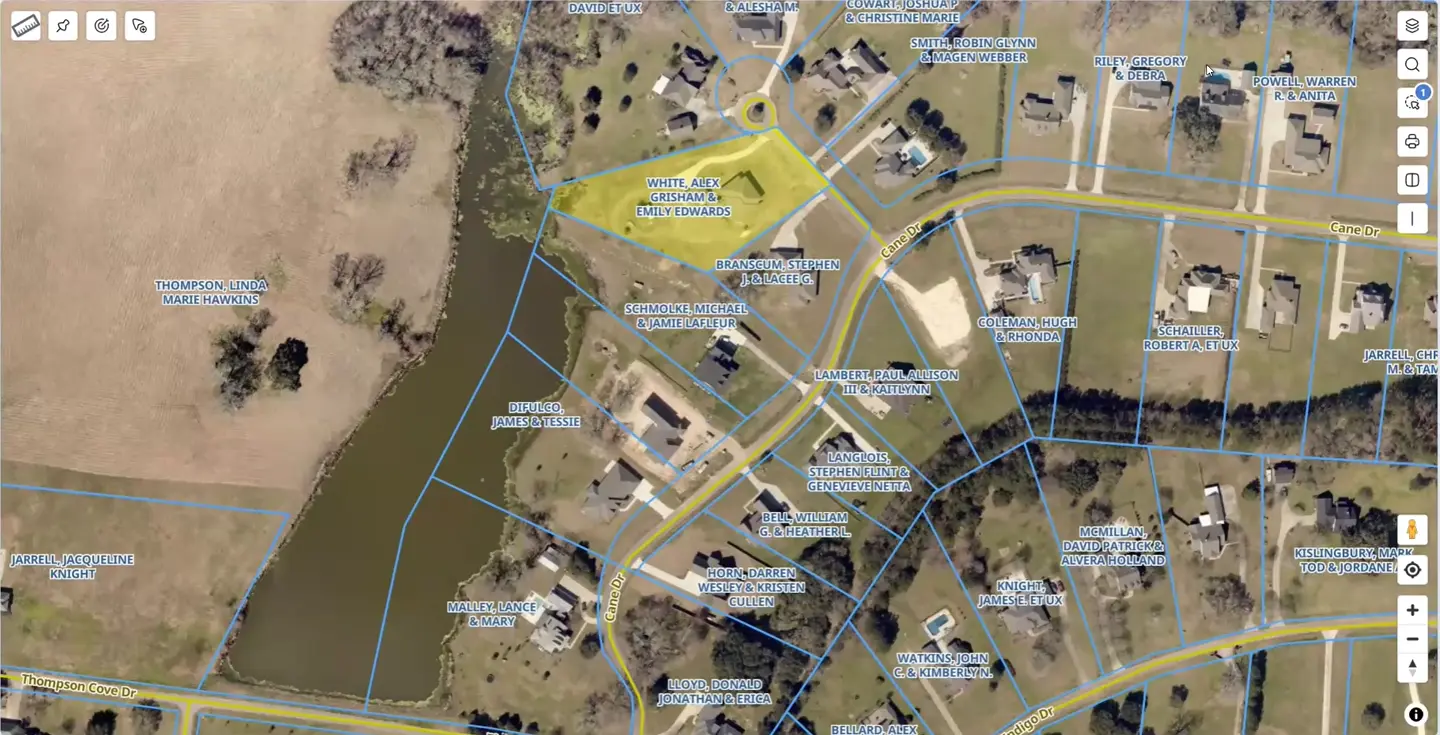
One search box for an owner’s name, address, or assessment number.
Connect visitors with schools, utility contacts, and public-safety resources—including phone numbers and website links.
Where configured, a tax-payment link takes visitors to the appropriate payment site.
A responsive experience for computers, tablets, and phones.
Choose the information available to the public, with additional details for staff.
02 / INCLUDED IN SMARTMAPS
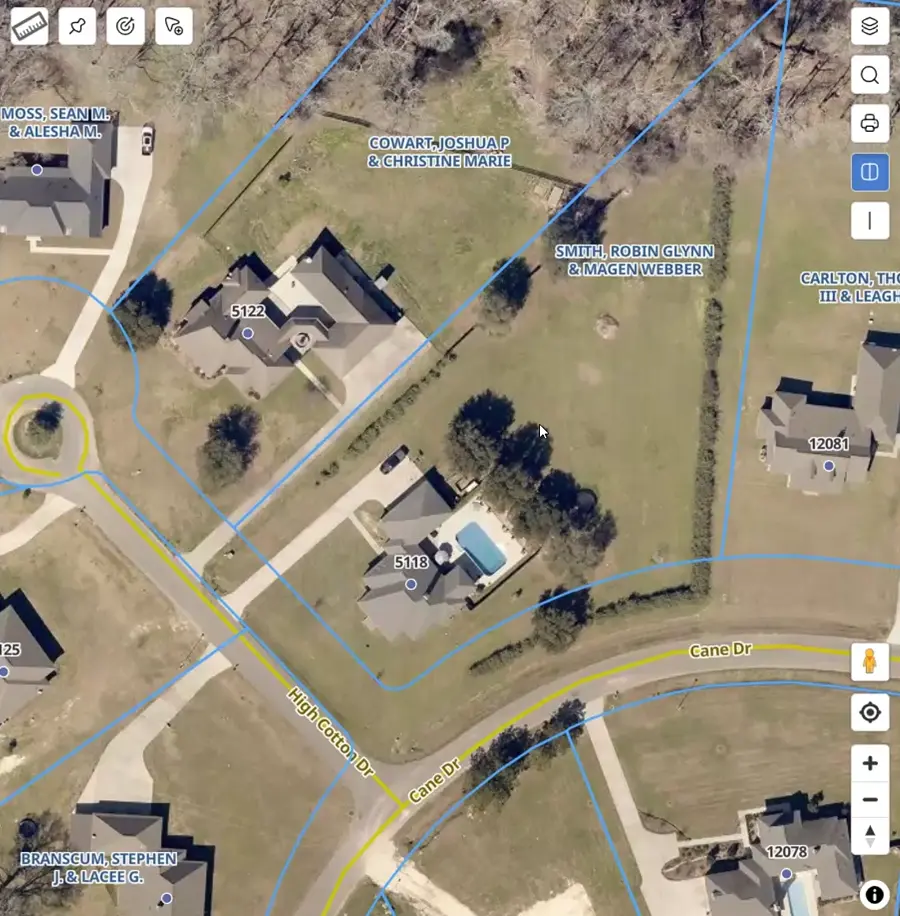
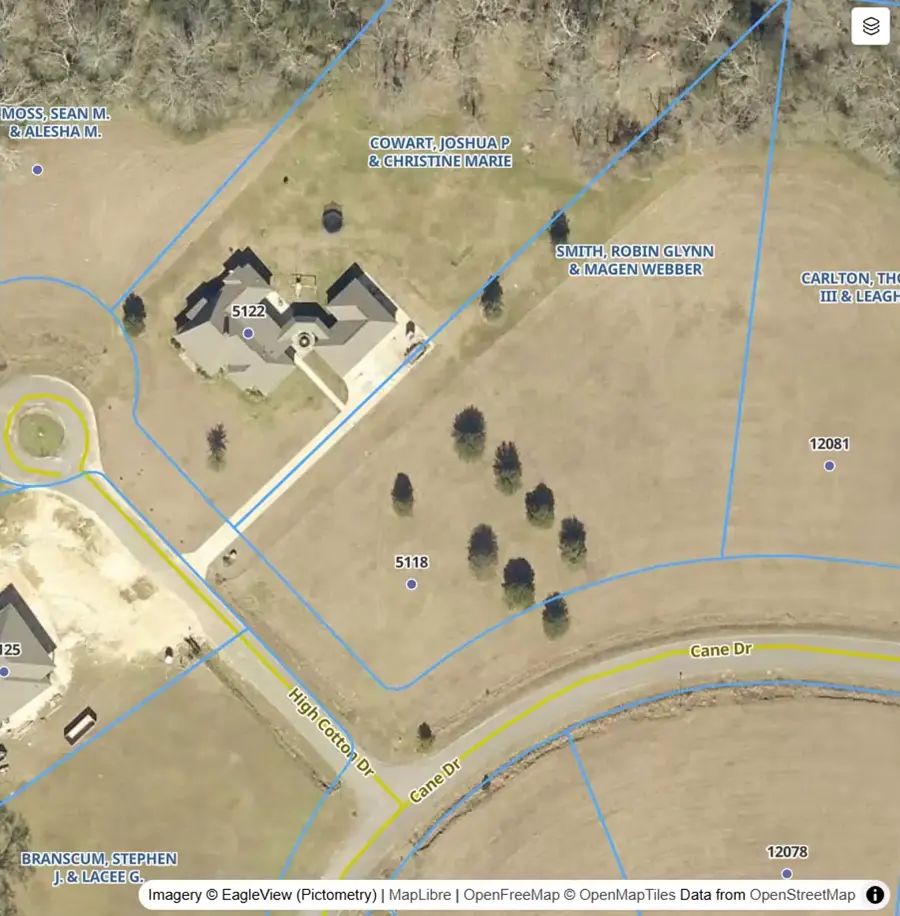
A new home. An addition. A pool. Compare imagery from different years to see what changed.
The imagery slider is part of the main SmartMaps package. Move across the same location and give your office another way to focus its review.
03 / PARCEL RATIO ANALYTICS
For offices looking to go further, bring sales ratios onto the map. Compare nearby properties, investigate patterns, and view analytical layers side by side.
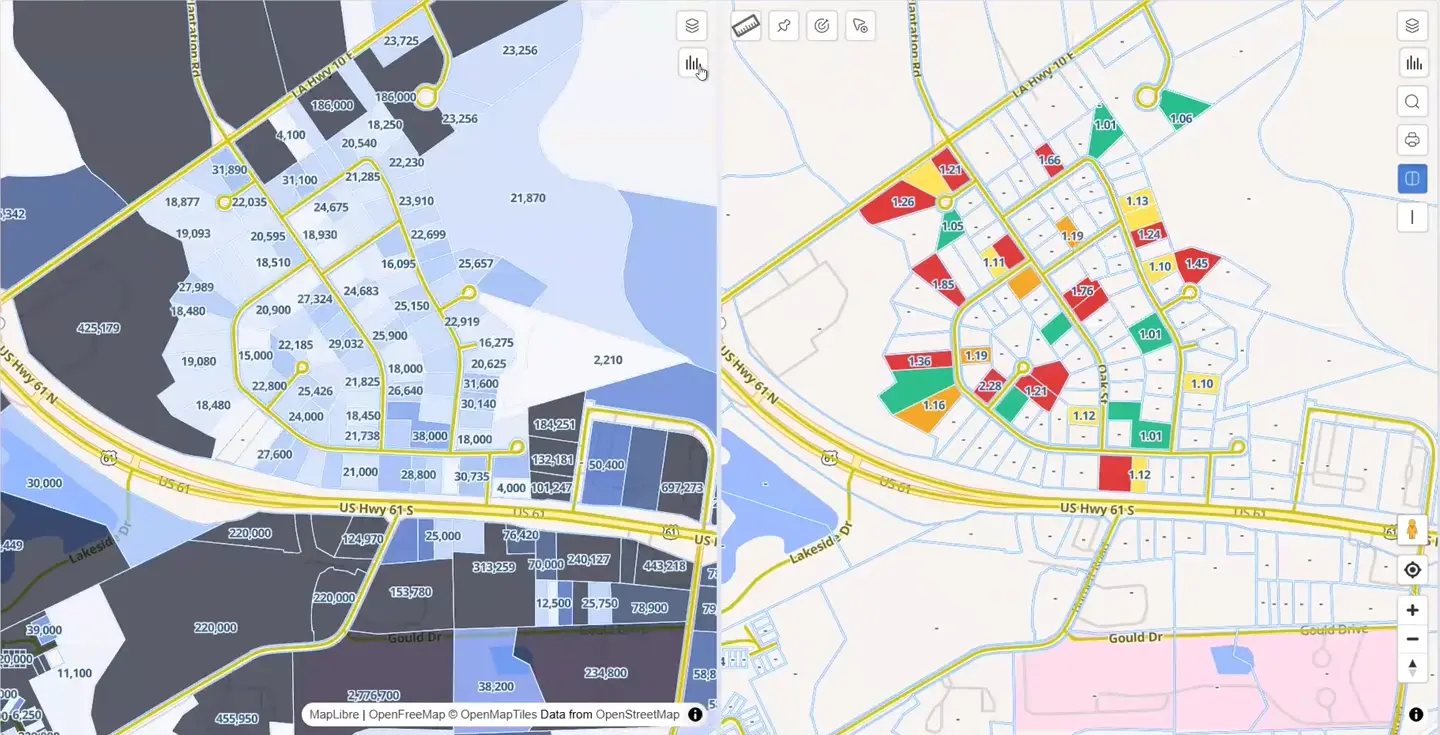
Buffering, measuring, drawing, and map printing support the tasks behind the review.
LET’S LOOK AT YOUR WORKFLOW
Tell us about your office, your property data, and the people you serve. We’ll walk you through SmartMaps.